|
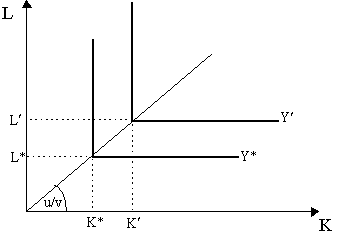
Contents (A) Leontief (Fixed Proportions) Technology. The concept of marginal productivity relies upon the idea of adding a particular factor to a production process while letting all other factors remain constant. This translates, in production theory, to changing the technique of production, which is a little more than a fancy term for the factor proportions employed in a particular production process. In the canonical smooth, two-input, one-output production function, Y = ¦ (K, L), the technique of production at any particular point is merely the capital-labor ratio, K/L. Consequently, refer to technology as the set of feasible techniques available to the producer. If the producer wishes to produce a particular desired level of output, Y*, then the technology he has available are all the capital-labor ratios matching the points on the relevant isoquant. (A) Leontief (Fixed-Proportions) Technology The smooth curvature of the isoquants in our previous section implies that we assumed that there was an infinite number of techniques available and that the producer could substitute continuously among them. Indeed, in order to be able to define the marginal product as a derivative, we need this assumption. However, we earlier spoke of the possibility that technology may be such that factors must, for some reason or other, be used in fixed, constant proportions. Taking Cassel's (1918) example, in digging a pit, adding an extra worker alone may not increase output if we do not also give him a spade and certainly, adding a spade alone will not increase output unless we also increase labor. In this case, labor and capital must work together in a constant proportion: one man, one spade. As we can see, there is no possibility of substituting a spade for a man or a man for a spade. This translates, in our context, to arguing that the technology facing the producer is composed entirely of a unique technique, i.e. capital and labor must be used in a fixed proportion. Suppose that our particular production function Y = ¦ (K, L) exhibits this fixed proportions property. In other words, let us suppose that to produce a single unit of output, we need v units of capital and u units of labor. There is no flexibility in technique here. The coefficients v and u are the fixed input requirements in order to produce a single unit of output. Consequently, if we want to produce Y units of output, we need vY units of capital and uY units of labor. In other words, K = vY are the capital requirements and L = uY are the labor requirements. As a result, the only technique is L/K = u/v. In other words, there is a particular fixed proportion of capital and labor required to produce output. An increase in either one of the factors by themselves without increasing the other proportionally will lead to absolutely no increase in output. The implied L-shaped isoquants of such a production function are shown in Figure 4.1. Such a technology is referred to alternatively as "Fixed Proportions" or "No Substitution", or "Marx-Leontief" or "Walras-Cassel" or "Input-Ouput" technology (or some iteration thereof). At any particular output level Y*, there is a necessary level of K* and L* which cannot be substituted. Note that these levels are determined purely technologically. Increasing only labor inputs (from L* to L¢ for instance) will not result in any higher output. Rather, the extra labor, without the extra capital to work with, will be entirely wasted. The implication is that fixed-proportions technology is "no less than a formal rejection of the marginal productivity theory. The marginal productivity of any [factor] ... is zero." (Leontief, 1941, p.38).
The production function for a no-substitute case can be written as:
which is also referred to as a Leontief production function - as this form was introduced by Wassily Leontief (1941). Notice that if K is at K* and L is at L¢ , then K*/v < L¢ /u. Thus, Y = K*/v. If so, then the technically efficient level of labor would, by definition, be where K*/v = L/u or L = (u/v)K* which, as is obvious in Figure 4.1, is at L*. As a result, then we can easily note that the following holds all along the ray from the origin:
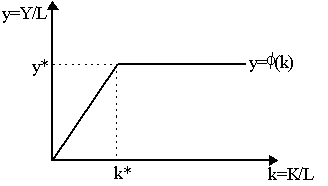
This implies that the intensive production function, y = f (k) where y = Y/L and k = K/L is effectively a straight line with slope 1/v up to the capital-labor ratio k* = K*/L* and is horizontal thereafter, as shown in Figure 4.2. This constrasts sharply with smooth concave intensive production function we considered earlier in Figure 3.4.
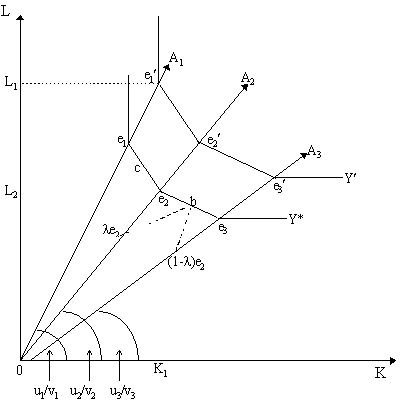
The reasoning for the shape is clear enough. In intensive production function representations, it is as if we are holding labor constant and just increasing capital.. Now, if the capital-labor ratio is precisely k* = K*/L*, we are sitting on the ray in Figure 4.1, thus the best one can do is produce y*. If we attempt to increase capital above K* (and thus increase the capital labor ratio above k*), output does not increase at all. Thus, the output-labor ratio remains unchanged at y*. However, if the capital labor ratio falls below k*, it is as if we reduced capital while leaving labor the same. As we know from Leontief production functions, we must reduce output. Alternatively, we could a decline in k below k* as leaving capital unchanged and just increasing the amount of labor. In either case, the output labor-ratio declines below y*. Thus, starting from k = 0, then up to k*, the output-labor ratio increases at rate 1/v, while after k* it remains unchanged. (B) Activity Analysis Technology A moderately more flexible version of this type of situation is the activity analysis form of production technology, introduced into economics largely by John von Neumann (1937) and taken up enthusiastically by the Neo-Walrasians (e.g. Koopmans, 1951). In addition to the already cited texts, activity analysis production theory is summarized in W.J. Baumol (1958, 1961), R. Dorfman (1958), R. Dorfman, P.A. Samuelson and R. M. Solow (1958) and D. Gale (1960). In activity analysis, producers can choose among a small, finite number of distinct production processes or activities. We do not use the word "technique" for reasons that will be clear soon. This is shown in Figure 4.3, where we are given three possible activities, represented by the rays A1, A2 and A3. In activity analysis, each of these rays is commonly referred to as an activity ray or a production process ray. Each of the activity rays has a different slope representing the different fixed proportions of capital and labor used in that particular activity. In Figure 4.3, we denote these slopes by the terms ui/vi. The terms ui, vi are the unit input coefficients for the ith activity. Specifically, to produce a single unit of output using technique Ai, we need vi units of capital and ui units of labor, thus to produce Y* units of output using that activity, the capital requirements are Ki = viY* and the labor requirements are Li = uiY*. Thus, the slope of the ith activity ray will be Li/Ki = ui/vi. Notice that this implies that, in Figure 4.3, u1/v1 > u2/v2 > u3/v3, which implies that A1 the most labor-intensive (and least-capital intensive) of the three activities, while A3 is the most capital-intensive (and least labor-intensive) process.
Now, we can achieve a particular level of output, Y*, by undertaking production processes A1, A2 or A3 or some combination of these. As a result, the activity analysis isoquant is kinked in Figure 4.3. Thus, if we choose to use process A2, then our labor-capital ratio must be u2/v2, as is forced upon us by the slope of the activity ray A2. However, in order to produce Y*, we need to be at point e2 on the activity ray A2. At e2, the inputs are K2 = v2Y* and L2 = u2Y*. If we wished to produce more output (say Y¢ ) but without changing technique, we would move radially up the activity line A2 from e2 to e2¢ in Figure 4.3. Note that the labor-capital ratio is the same at both these points. The advantage of activity analysis models over our earlier Leontief ones is that we are not constrained to using only one activity. We can, for instance, use two activities at the same time. Suppose, as shown in Figure 4.3, we choose to produce output Y*, but by using a combination of activities A2 and A3. In other words, we produce some of our output using process A2 and some of it using process A3. As a result, we end up at point b on the isoquant in Figure 4.3. Note that b lies on a straight line between e2 and e3 thus we can say it is some convex combination of the two activities:
where l Î (0, 1). Thus, the level of use of activity A2 is scaled down from e2 to l e2 on activity ray A2, while the level of use of activity A3 is scaled down from e3 to (1-l )e3 on activity ray A3. The use of capital at point b would be:
where v2 is the capital-output ratio in activity A2 and v3 the capital-output ratio in activity A3. Similarly the employment of labor implied by b is:
Thus, the use of capital and labor will be partly allocated to one process and partly allocated to another. In other words, the producer at b will use two processes (A2 to A3), allocating proportion l of the total activity to process A2 and the rest (1-l ) to process A3. As l approaches 1, we will move from less use of process A3 to more use of process A2 to produce the desired level of output, Y*, (i.e. the b would be closer to e2 than e3). As we see, activity analysis isoquants allow us not only to choose among several different production processes, but also any combination of production processes. Thus, compared with the Leontief case, the activity analysis production technology allows for a (modest) degree of substitability between different factors by allowing producers to choose combinations of different activities. More strictly, combinations of A1 and A2 (such as at c in Figure 4.3) and combinations of A2 and A3 (such as at point b) are allowed. However, note that no combinations of processes A1 and A3 will be contemplated to produce output Y*. This is not due to lack of possibility but rather because of the lack of efficiency of any such combination. In particular, a convex combination of e1 and e3 would lie above the isoquant formed by e1e2e3, but this does not imply a higher level of output but rather higher uses of inputs to produce the same output. Thus, combinations of A1 and A3 are inefficient. (cf. Koopmans, 1951). Note that while there is subsitutability between production processes, there is still no guarantee that factor prices will be decisive in determining factor proportions. For instance, if the isocost rests on the A1A2 segment, we might choose R, but we can also very well choose any other point on that segment. Thus, factor price ratios will only determine "more or less" the activity (or activities) we will use, but will not determine the precise proportions of capital and labor employed. While substitution exists, it is "moderate". It is not "substitution" between factors, but rather substitution between activities. In order to compare activity analysis production functions with other production functions, it may be useful to visualize the resulting kinked intensive production function y = f (k), as shown in Figure 4.4. The labelling corresponds to the three-activity scenario we had earlier in Figure 4.3. The logic for this shape is simple. Let the output-labor ratio for the ith process used be denoted yi = (Y/L)i = 1/ui and the capital-labor ratio is ki = (K/L)i = vi/ui. Thus:
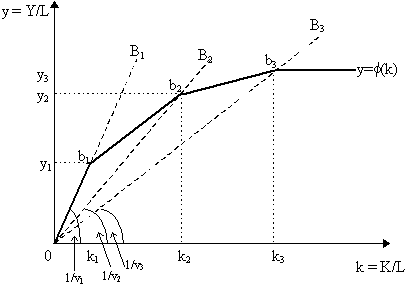
As this is true for a particular activity, we can impose three new rays, B1, B2 and B3, with slopes yi/ki = 1/vi for each of the three activities representing the three activities in Figure 4.4. Now, from Figure 4.3, we know that v1 < v2 < v3 as A3 is the most capital-intensive and A1 is the least capital-intensive. Thus, B1 is the steepest ray and B3 is the flattest, as we see in Figure 4.4.
Let us now trace out the resulting intensive production function in Figure 4.4. Capital-labor ratios k1, k2 and k3 on the horizontal axis correspond to v1/u1, v2/u2 and v3/u3 respectively. Consequently, if the capital-labor ratio is precisely k1, then the most efficient thing to do is adopt activity A1 and produce as much as we can. To see why this is the case, consider our earlier Figure 4.3 again. Suppose the capital labor endowment is K1 and L1, so that the capital-labor ratio is k1 = K1/L1. Now, if the producer uses the labor-intensive process A1 he can produce at activity level e1¢ and achieve output Y¢ . However, if we force him to use the more capital-intensive process A2, he will be produce at activity level e2 and thus achieve the lower output Y*. This is because the more capital-intensive process will be able to absorb the entire amount of capital, K1, but it can only use L2 of labor, thus the remaining labor, L1-L2, will have to be thrown away. Thus, it is not efficient to use process A2 when facing a low capital-labor ratio such as k1 = K1/L1. Let us return to Figure 4.4. By what we have just said, when capital-labor ratio is k1, we will produce with process A1 and achieve output-labor ratio y1. Using the same logic, if the capital-labor ratio is precisely k2, the most efficient avenue is to produce with process A2 and achieve output-labor ratio y2. Simlarly, if the capital-labor ratio is exactly k3, we produce with process A3 and achieve output-labor ratio y3. Now, by an analogous logic to that of the earlier Leontief case, if the capital-labor ratio is so low that it lies below k1, then the most efficient thing to do is to produce output completely in accordance with the most labor-intensive process available. There will be waste, of course, as labor is so plentiful that some of it will go unused, but it is the best that can be done given that only these three activities are available. Consequently, for capital-labor ratios below k1, activity A1 will be used exclusively, consequently the output achieved will be according to the B1 ray for the same reasoning we gave in the Leontief case. Indeed, as we saw in Figure 4.3, the isoquant above the A1 ray is vertical, precisely as in Leontief. If, in contrast, the capital-labor ratio is very high (above k3) then the best thing to do is to adopt the most capital-intensive process available, namely A3. Again, there will be waste of capital, but it is the best we can do. Note that, again, in Figure 4.3, the isoquant beyond the A3 ray is horizontal, as in Leontief, thus the reasoning for a horizontal portion of the production function above k3 is the same. In other words, increasing capital-labor ratio beyond k3 results in no increase in the output-labor ratio. The interesting portion of the production function in Figure 4.4 is that between k1 and k3. The points on the production function between the rays B1 and B2 correspond to combinations of processes A1 and A2, as in our earlier Figure 4.3. Similarly, points on the production function between B2 and B3 correspond to combinations of processes A2 and A3. We can see immediately here why a combination between activities A1 and A3 is inefficient: a chord connecting the kinks of the production function at b1 and b3 would lie entirely below the production function, thus it is inefficient. In sum, the intensive activity analysis production function shows that increasing from labor-intensive to capital-intensive techniques, we move from low capital-labor (and low output-labor) ratios to higher capital-labor (and high output-labor) ratios. To understand the activity analysis production used in von Neumann and Neo-Walrasian models, it is useful to introduce some more general notaiton. Let there be k different production processes or activities. Let there be m factors of production. A production process is characterized by a unit intensity vector, denoted ai. In general, a unit intensity vector is an m-dimensional vector:
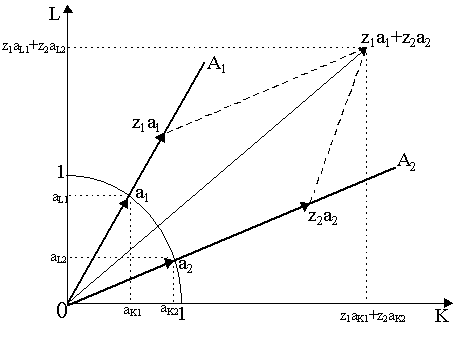
where aji is a unit input coefficient denoting to the amount of factor j required by activity i when activity i is run at "unit intensity". Note that these unit input coefficients in activity analysis are different from those used in input-output analysis. A unit input coefficient aji does not indicate the amount of input j required to produce a unit of output via process i. Rather, it indicates the amount of input j required to produce whatever units of output are produced when process i is run at so-called "unit intensity". Thus, aji is not the general analogue of our earlier coefficients ui or vi. To understand the meaning of unit intensity, refer to Figure 4.5. Here we have two factors (capital K and labor L) and two activities represented by their activity rays from the origin, A1 and A2 respectively. Notice that there is a curve connecting points (1, 0) and (0, 1) is the "normalizing" curve (it is part of the circumference of a circle with radius 1). Activity i is run at unit intensity if the vector representing it is on the this curve. Thus, a1 is the unit intensity vector of activity A1 and a2 is the unit intensity vector of activity A2. Notice that a1 = [aK1, aL1] and a2 = [aK2, aL2], thus the slope of the activity ray A1 is aL1/aK1 and the slope of activity ray A2 is aL2/ak2.
Any particular point along an activity ray Ai can be represented as a scaling up or down of the unit intensity vector. Thus, any vector on Ai can be denoted ziai where zi is referred to as the intensity of activity i. This is not normalized and does not represent a "fraction" in any sense. Rather, if zi > 0, it means that activity Ai is run at more-than-unit intensity (moves up along ray Ai above ai) and if zi < 0, then activity Ai is run at less-than-unit intensity (moves down along ray Ai below ai). Thus, in our earlier Figure 4.3, e2, l e2 and e2¢ can all be expressed as scalings up (or down) of the unit-intensity vector a2. The factor requirements of a particular activity Ai run at a particular intensity zi can be defined accordingly: specifically, the requirement of factor j by activity Ai is ziaji. Suppose, as in Figure 4.5, activity A1 is run at intensity z1 and activity A2 is run at intensity z2. Therefore, z1aK1 represents the capital requirements by process 1 and z2aK2 represents the capital requirements by process 2, so that total capital requirements are z1aK1 + z2aK2. Similarly, total labor requirements are z1aL1 + z2aL2. Thus the input combination used in the economy is represented by vector z1a1 + z2a2, which is shown in Figure 4.5 as the sum of the vectors z1a1 and z2a2. As z1, z2 > 0 in Figure 4.5, then the total inputs required when we run both activities at vector z1a1 + z2a2 is more than just running one of the activities at z1a1 and that, in turn, is greater than that activity at its unit-intensity level, at a1. Consequently, we would expect the output produced by a1 is less than that of z1a1 and that, in turn, is less than the output achieved at z1a1 + z2a2. Thus, the activity analysis isoquants we had earlier drawn out in Figure 4.3 can be overlaid on Figure 4.5. We can denote by yi the level of output produced by running activity i at unit intensity. Thus, y1 corresponds to the output achieved by vector a1 and y2 represents the output achieved by vector a2. Consequently, z1y1 is the output achieved by vector z1a1 and, of course, z1y1 + z2y2 is the output corresponding to factor input combination z1a1 + z2a2. Thus, in general, we can write the activity analysis production function as:
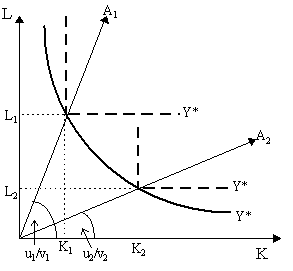
where zi is the intensity of the ith activity and yi is the unit intensity output of process i. This production function is what is commonly found in activity analysis. There are a few points worth clarifying here. First, as has been noticed, we are assiduously avoiding using the term "technique" with regard to our activities A1, A2 and A3. This is because, as we saw, while only three "activities" are available, we were nonetheless able to accommodate a whole series of capital-labor ratios by combining activities. Indeed, as we saw in Figure 4.4, every capital-labor ratio between k1 and k3 is available to the producer, thus the number of techniques available, which are defined by the factor proportions available, are indeed infinite. Thus, when moving from any capital-labor ratio to another, the producer is indeed changing technique in the strictest sense, even though all he might be doing is changing the relative degree of intensity of use of the same two activities, A1 and A2. Thus, there are an infinite number of techniques but only a finite number of activities. Secondly, it is noticeable that one of the great casualties of activity analysis when there are a finite number of activities is the very concept of marginal productivity. Strictly speaking, kink points such as b1 or b2 in Figure 4.4, are simply not differentiable and thus marginal productivity is not defined, at least as a derivative. One of the solutions pursued by economists is to use a generalized concept of derivative, known as the Clarke Normal Cone, as introduced into economics by Bernard Cornet (1982). However, this takes us a bit too far afield, for the moment. For a review of the analysis of non-smooth derivatives, see the excellent review by Donald J. Brown (1991). Thirdly, one of the main lessons of the activity analysis production function is that we can conceive of the conventional, smooth concave production production function and smooth isoquants as a limiting case of activity analysis production functions. Specifically, if we increase the number of activities, the number of kinks in the isoquants and the production function would increase. If we had an infinite number of activities available - in fact, a continuum of them - so that. every capital-labor ratio would be represented by its own activity, there would be no kinks at all: the isoquant and the production function would be nice, smooth and differentiable, as commonly stipulated in conventional production theory. In such a case, one need no longer speak of substitution between activities as such and just talk about substitution between techniques directly. Another way of reconciling smooth production technology with activity analysis or even Leontief technology, would be via the Marshallian time dimension. Specifically, Marshall (1890) had argued that the degree of substitution between factors is not immutable over different time horizons. As he argued, in the long-run, all factors are variable and can be substituted with little difficulty, but in the short-run, the degree of substitution between factors is more limited. Thus, "fixed capital" is fixed in the short-run and variable in the long-run. This implies that one can think that in the long-run, we face a smoother production technology than in the short run. One can incorporates this idea via the notion of "putty-clay" production technology, as pursued by Leif Johansen (1959), W.E.G. Salter (1960) and Robert M. Solow (1962). The basic idea is that before production begins, an entrepreneur is faced with a wide variety of possible techiniques of production he can use. However, once he decides upon a given technique and sets production in motion, he has fewer possibilities of further substitution: the machines are in place, contracts are in force, etc., thus he cannot easily fire-and-hire at will. Thus the term "putty-clay" technology: putty can be molded as we wish before baking, but once baked, it becomes hardened clay and we cannot change its shape. Thus, putty-clay models distinguish between ex ante (or "putty") and ex post (or "clay") technology. Heuristically, ex ante production technology will tend to have high substitution possibilities, and thus is probably closer to the smooth production functions of conventional Neoclassical models. However, ex post production technology has far fewer substitution possibilities, and thus is closer to the Leontief case. To see the implications, consider the example depicted in Figure 4.6. Suppose that labor is fluid but capital, once decided upon, stays in place in the short-run. The entrepreneur wishes to produce Y* and his ex ante technological possibilities are all the points on the smooth isoquant Y*. Suppose the entrepreneur happens to choose the technique indicated by the activity ray A1. The ex post technology thus becomes the Leontief isoquant formed at that point with capital requirements K1 = v1Y* and labor requirements L1 = u1Y*. In constrast, had he chosen a different technique, e.g. A2, then his ex post technology becomes the Leontief isoquants formed by the ray A2.
The situation depicted in Figure 4.6, thus, represents the most extreme form of putty-clay model: complete ex ante substitution (represented by smooth isoquant) and absolutely no ex post substitution (represented by the Leontief isoquants that emerge after the choice). Putty-clay technology is not easily representable by an all-encompassing production function precisely because ex post technology is dependent on the initial choice of technique. Nonetheless, it is useful to envisage production technology in putty-clay terms, as it provides another way of thinking about the smooth technology used in conventional production functions. Specifically, with putty-clay in mind, we need not necessarily think of smooth production functions as the idealistic "limiting" case of activity analysis technology but rather as merely "long-run" production technology. In other words, smooth production technology should not be expected to apply in reality at any time or over short-periods of time (a few years), but it ought to be the case when one examines technological possibilities over a long stretch of time (say, a few decades or even a century).
|
All rights reserved, Gonçalo L. Fonseca

